728x90
반응형
Prometheus는 오픈소스 기반의 모니터링 및 알림 도구로, 시스템 및 서비스의 다양한 메트릭을 시계열로 수집하여 실시간으로 시각화할 수 있습니다. Node Exporter와 함께 사용하면 리눅스 시스템의 CPU, Memory, Disk, Network 등의 정보를 수집하고 웹 UI 및 Grafana와 연동하여 모니터링할 수 있습니다.
1. Prometheus 개요
- Node Exporter는 메트릭 수집용 에이전트입니다.
- Prometheus는 Node Exporter가 제공하는
/metrics엔드포인트를 주기적으로 수집(scrape)합니다. - 수집된 메트릭은 PromQL 쿼리 언어를 사용해 분석 및 시각화할 수 있습니다.
- Grafana와 연동 시 더욱 직관적인 대시보드 구성이 가능합니다.
2. Prometheus 설치
✅ prometheus 사용자 생성
useradd -m -s /bin/false prometheus
✅ 디렉토리 생성 및 권한 부여
mkdir /etc/prometheus /var/lib/prometheus
chown prometheus /var/lib/prometheus
✅ 바이너리 다운로드 및 배포
dnf install -y wget
wget https://github.com/prometheus/prometheus/releases/download/v2.14.0/prometheus-2.14.0.linux-amd64.tar.gz -P /tmp
cd /tmp
tar -zxpvf prometheus-2.14.0.linux-amd64.tar.gz
cd prometheus-2.14.0.linux-amd64
cp -pr prometheus promtool /usr/local/bin/
3. Prometheus 구성 및 서비스 등록
✅ 구성 파일 생성
vi /etc/prometheus/prometheus.yml
global:
  scrape_interval:     15s
  evaluation_interval: 15s
  scrape_timeout: 15s

scrape_configs:
  - job_name: 'prometheus'
    static_configs:
    - targets: ['localhost:9090']
✅ systemd 서비스 파일 생성
vi /etc/systemd/system/prometheus.service
[Unit]
Description=Prometheus Monitoring
Wants=network-online.target
After=network-online.target

[Service]
User=prometheus
Group=prometheus
ExecStart=/usr/local/bin/prometheus \
  --config.file /etc/prometheus/prometheus.yml \
  --storage.tsdb.path /var/lib/prometheus/ \
  --web.console.templates=/etc/prometheus/consoles \
  --web.console.libraries=/etc/prometheus/console_libraries

[Install]
WantedBy=multi-user.target
✅ 서비스 시작
systemctl daemon-reload
systemctl enable --now prometheus
✅ 방화벽 설정
firewall-cmd --add-port=9090/tcp --permanent
firewall-cmd --reload
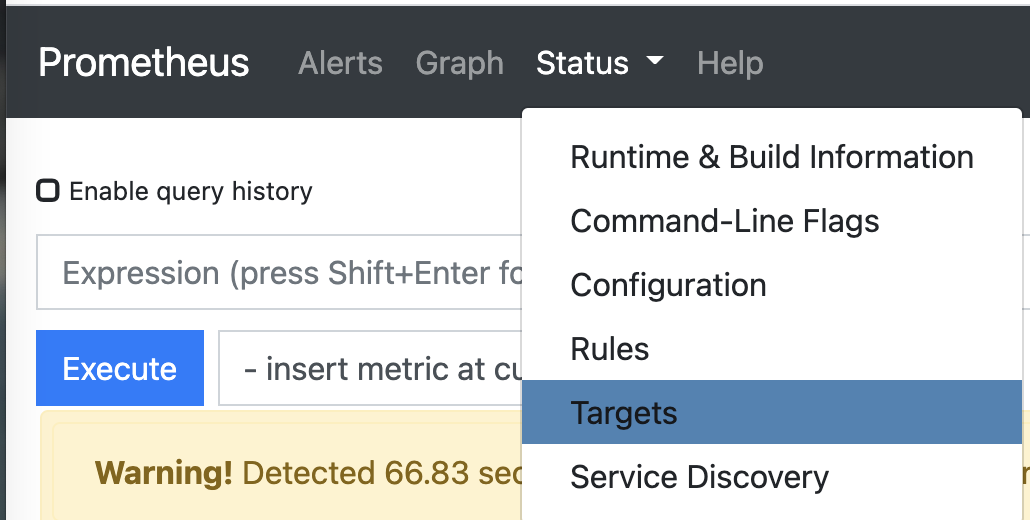
4. 웹 UI 접속
웹 브라우저에서 http://서버IP:9090 접속합니다.
- Status → Targets 클릭
- localhost:9090이 정상적으로 수집되고 있는지 확인


5. Node Exporter 설치
메트릭 수집을 위한 에이전트를 별도 시스템에 설치합니다 (예: KVM Host).
✅ 사용자 및 바이너리 설치
useradd -m -s /bin/false node_exporter

wget https://github.com/prometheus/node_exporter/releases/download/v0.18.1/node_exporter-0.18.1.linux-amd64.tar.gz
tar -zxpvf node_exporter-0.18.1.linux-amd64.tar.gz
cp node_exporter-0.18.1.linux-amd64/node_exporter /usr/local/bin/
chown node_exporter:node_exporter /usr/local/bin/node_exporter
✅ systemd 서비스 등록
vi /etc/systemd/system/node_exporter.service
[Unit]
Description=Prometheus Node Exporter
Wants=network-online.target
After=network-online.target

[Service]
User=node_exporter
Group=node_exporter
ExecStart=/usr/local/bin/node_exporter

[Install]
WantedBy=multi-user.target
systemctl daemon-reload
systemctl enable --now node_exporter
✅ 방화벽 허용
firewall-cmd --add-port=9100/tcp --permanent
firewall-cmd --reload
6. Prometheus에 Node Exporter 연동
✅ prometheus.yml 수정
- job_name: 'kvmhost'
  static_configs:
  - targets: ['xx.xx.xx.4:9100']
✅ Prometheus 재시작
systemctl restart prometheus
✅ Web UI 확인
- http://서버IP:9090 → Status → Targets
- node_exporter 타겟이 추가되었는지 확인

7. 메트릭 정보 확인
✅ CLI 또는 브라우저로 확인
curl http://xx.xx.xx.4:9100/metrics
go_gc_duration_seconds, node_cpu_seconds_total 등 다양한 메트릭을 확인할 수 있습니다.
8. 그래프 시각화
- Prometheus 웹 UI 접속 (http://서버IP:9090)
- “Graph” 메뉴 클릭
- 예:
node_cpu_seconds_total입력 → Execute 클릭 - Graph 탭 선택
선택한 메트릭의 실시간 추이를 그래프로 확인할 수 있습니다.


728x90
반응형
'모니터링' 카테고리의 다른 글
| Grafana 시간대 설정 방법 (한국 시간 맞추기) (0) | 2025.05.16 |
|---|---|
| grafana 설치 및 Zabbix 플러그인 설정 가이드 (CentOS/RHEL 기반) (0) | 2025.05.16 |
| RHEL에 Zabbix 클라이언트 (에이전트) 설치 및 구성 가이드 (0) | 2025.05.16 |
| RHEL에 Zabbix 서버 설치 및 구성 가이드 (0) | 2025.05.16 |